First, a note - this webpage is seriously under construction, so at some point soon I'll probably add more information. This is just a small sample of what I've been doing recently...
In early 2017, the reservoir behind the Oroville Dam in Oroville, California grew dangerously full. The dam operators released water more rapidly than usual to prepare for approaching winter storms, and by February 11, 2017, the torrent of water had begun to destroy both the main and emergency spillways, washing rubble into the Feather River.1 The total reservoir outflow reached a peak of 100,089 cubic feet per second on February 16, 2017.2
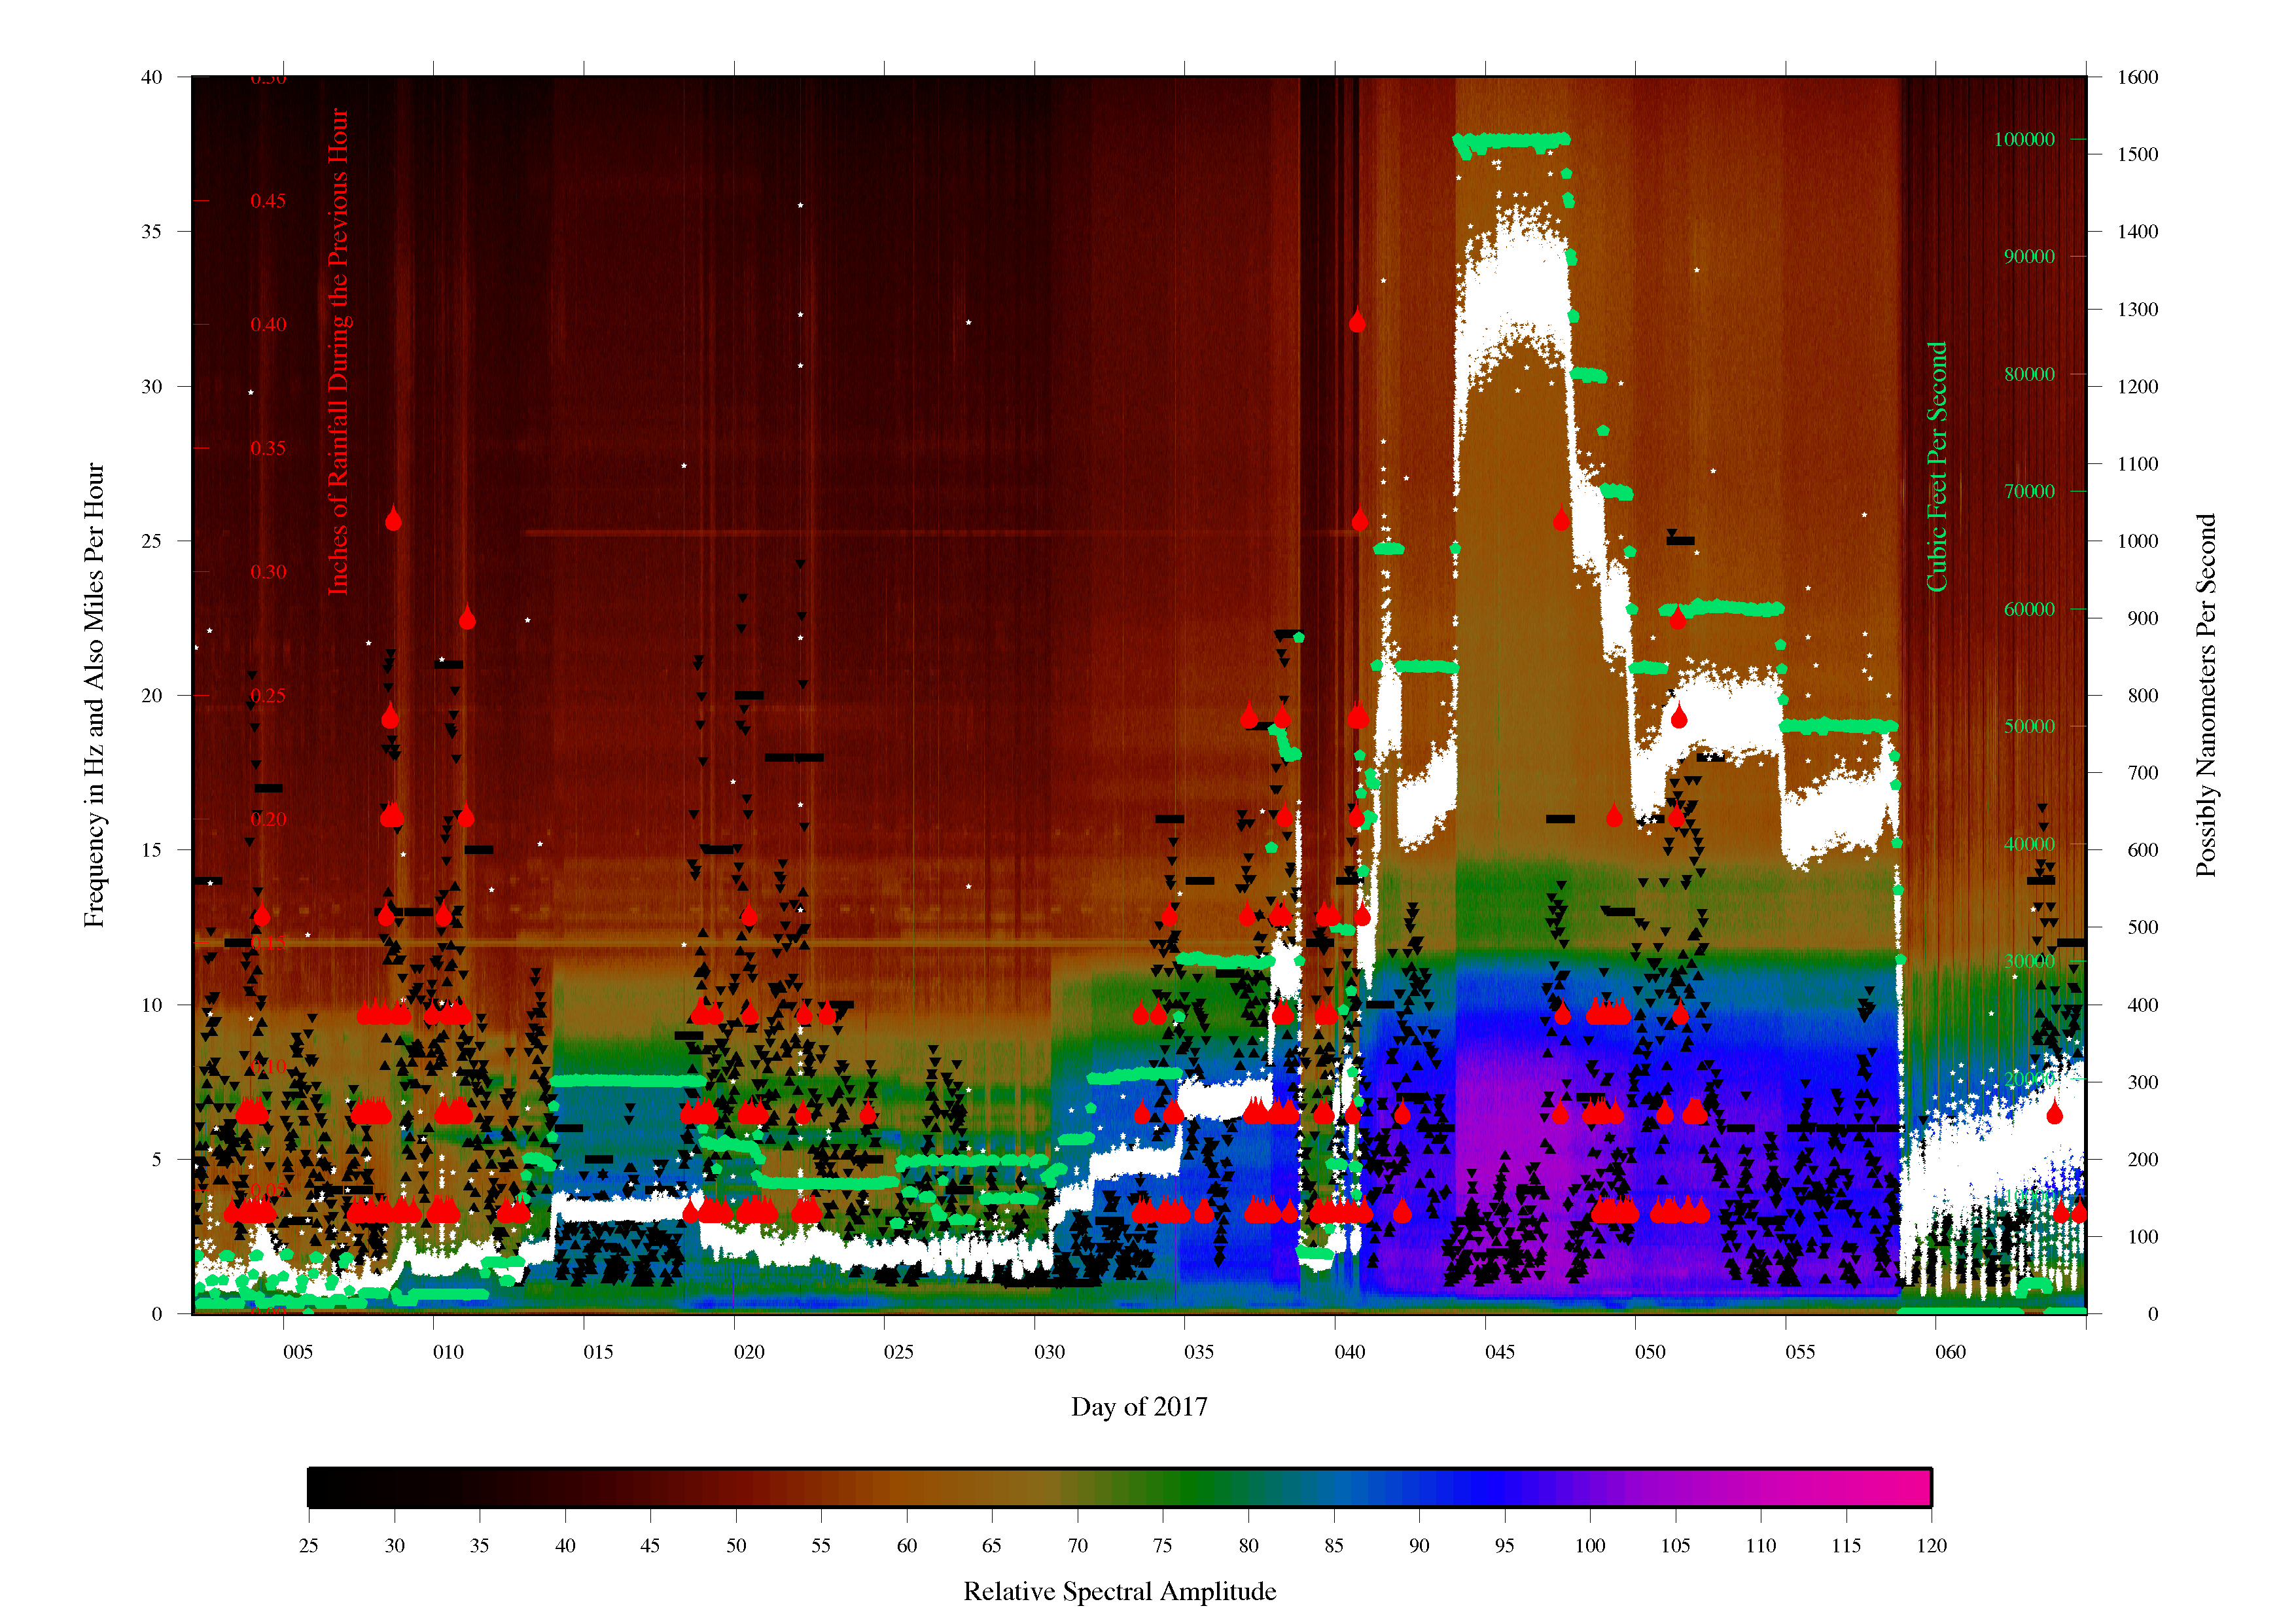
The nearest seismic station, Berkeley Digital Seismic Network's ORV, perches on the hill above the Feather River within several kilometers of Oroville Dam's main and emergency spillways.2, 3 I requested data from the Berkeley Digital Seismic Network's BK ORV instrument and have been playing with data from the HHZ channel, which has a sampling rate of 100 Hz.3 At the moment, I'm in the process of searching for hysteresis loops such as found by Schmandt et al., 20134 - i.e., different amplitudes of seismic signal at a given frequency and given reservoir outflow, depending on whether the outflow is increasing or decreasing at that moment - but in the meantime, here's one of my favorite plots from earlier this summer -
The above plot is a ridiculous several-months-long combination BK ORV HHZ spectrogram, represented by the background colors with relative spectral amplitudes shown by the scalebar below the plot for frequencies on the outer lefthand axis of the plot; per-minute average amplitude of 0.5-to-40-Hz bandpass-filtered BK ORV HHZ data, represented by the white stars scaled to the outer righthand axis; hourly reservoir outflow from the Oroville Dam, represented by the pale teal pentagons scaled to the inner righthand axis; average daily windspeeds at the Oroville Municipal Airport, represented by black horizontal bars scaled to the outer lefthand axis; average hourly windspeeds at the California Irrigation Management Information System's vaguely-nearby Biggs and Durham weather stations, respectively represented by point-down and point-up black triangles and also scaled to the outer lefthand axis; and rainfall within the previous hour over Oroville Dam, represented by red stylized raindrops scaled to the inner lefthand axis. The horizontal axis shows the day of 2017, counting from one at midnight of January 1, 2017.
I obtained the original BK ORV HHZ seismic data from the Northern California Earthquake Data Center.3 The reservoir outflow and rainfall data came from the California Data Exchange Center.2 The Oroville daily average windspeeds came from the KOVE weather station at the Oroville Municipal Airport, via the Weather Underground website.5 The Biggs and Durham hourly windspeed data came from the California Department of Water Resources - California Irrigation Management Information System.6
Now, here's my attempt to make another plot... This one should show Oroville Dam hourly reservoir outflow from January 1st through February 28th for both 2016 and 2017, again with data from the California Data Exchange Center.2
1. Graff, Amy. "Oroville Dam spillway timeline." SFGATE. San Francisco Chronicle. March 2, 2017. Most recently accessed on June 16, 2017. http://www.sfgate.com/news/slideshow/Timeline-Oroville-Dam-141918/photo-12474702.php
2. Reservoir outflow and accumulated precipitation data - both hourly - are from "Oroville Dam." California Data Exchange Center. Most recently accessed on June 19, 2017. https://cdec.water.ca.gov/cgi-progs/stationInfo?station_id=ORO
3. Seismic data and instrument metadata for the Berkeley Digital Seismic Network instrument "BK ORV" acquired via the Northern California Earthquake Data Center "FDSN Dataselect Web Service." http://service.ncedc.org/fdsnws/dataselect/1/
4. Schmandt, Brandon; Aster, Richard C.; Scherler, Dirk; Tsai, Victor C.; Karlstrom, Karl. "Multiple fluvial processes detected by riverside seismic and infrasound monitoring of a controlled flood in the Grand Canyon." Geophysical Research Letters, Volume 40, pages 4858-4863, 2013. doi:10.1002/grl.50953
5. Oroville Municipal Airport average daily windspeed data acquired via the Weather Underground "Weather History for Oroville, CA" webpage at https://www.wunderground.com/history/airport/KOVE/2017/1/1/CustomHistory.html?dayend=12&monthend=3&yearend=2017&req_city=&req_state=&req_statename=&reqdb.zip=&reqdb.magic=&reqdb.wmo
6. Hourly windspeed data from the Biggs and Durham weather stations, operated by the California Department of Water Resources for the California Irrigation Management Information System network, acquired from ftp://ftpcimis.water.ca.gov/pub2/monthly/
Also, major credit where credit is due! I made the first plot with Generic Mapping Tools Version 4.5.15; you can find more information about GMT at http://gmt.soest.hawaii.edu/projects/gmt . I made the second plot with a Scalable Vector Graphics script.
Last updated on September 27, 2017, by Kathryn Dorn. You can link to my website and you can reference it as long as you cite it properly, but you are by no means allowed to plagiarize from it. Also, the contents of this page do not reflect the views, approval, opinions, or much else of my employer and current school, the University of South Florida, aside from that I conducted this research with USF resources.