On June 29, 2014, a Mw = 5.2 earthquake occurred near Duncan, Arizona, close to the eastern border of the state...and I will add more to this later! But at the moment, I'm supposed to be working on too many other tasks to do justice to fully describing this research project. Very briefly -
Jeri Young with the Arizona Geological Survey let me work on data from a temporary network of two broadband and four short-period seismometers deployed near the mainshock's epicenter to catch its aftershock sequence. In 2016, I used the Antelope suite of programs by Boulder Real Time Technologies to find preliminary hypocenters and local magnitudes for thousands of aftershocks, but only used direct primary-wave arrivals; now I'm in the process of selecting shear-wave arrivals for those same aftershocks in order to refine their hypocenter locations, especially their depths. MORE DETAILS ON OTHER PARTS OF THIS PROJECT TO APPEAR HERE SHORTLY! For now, I'm just going to give you a map...
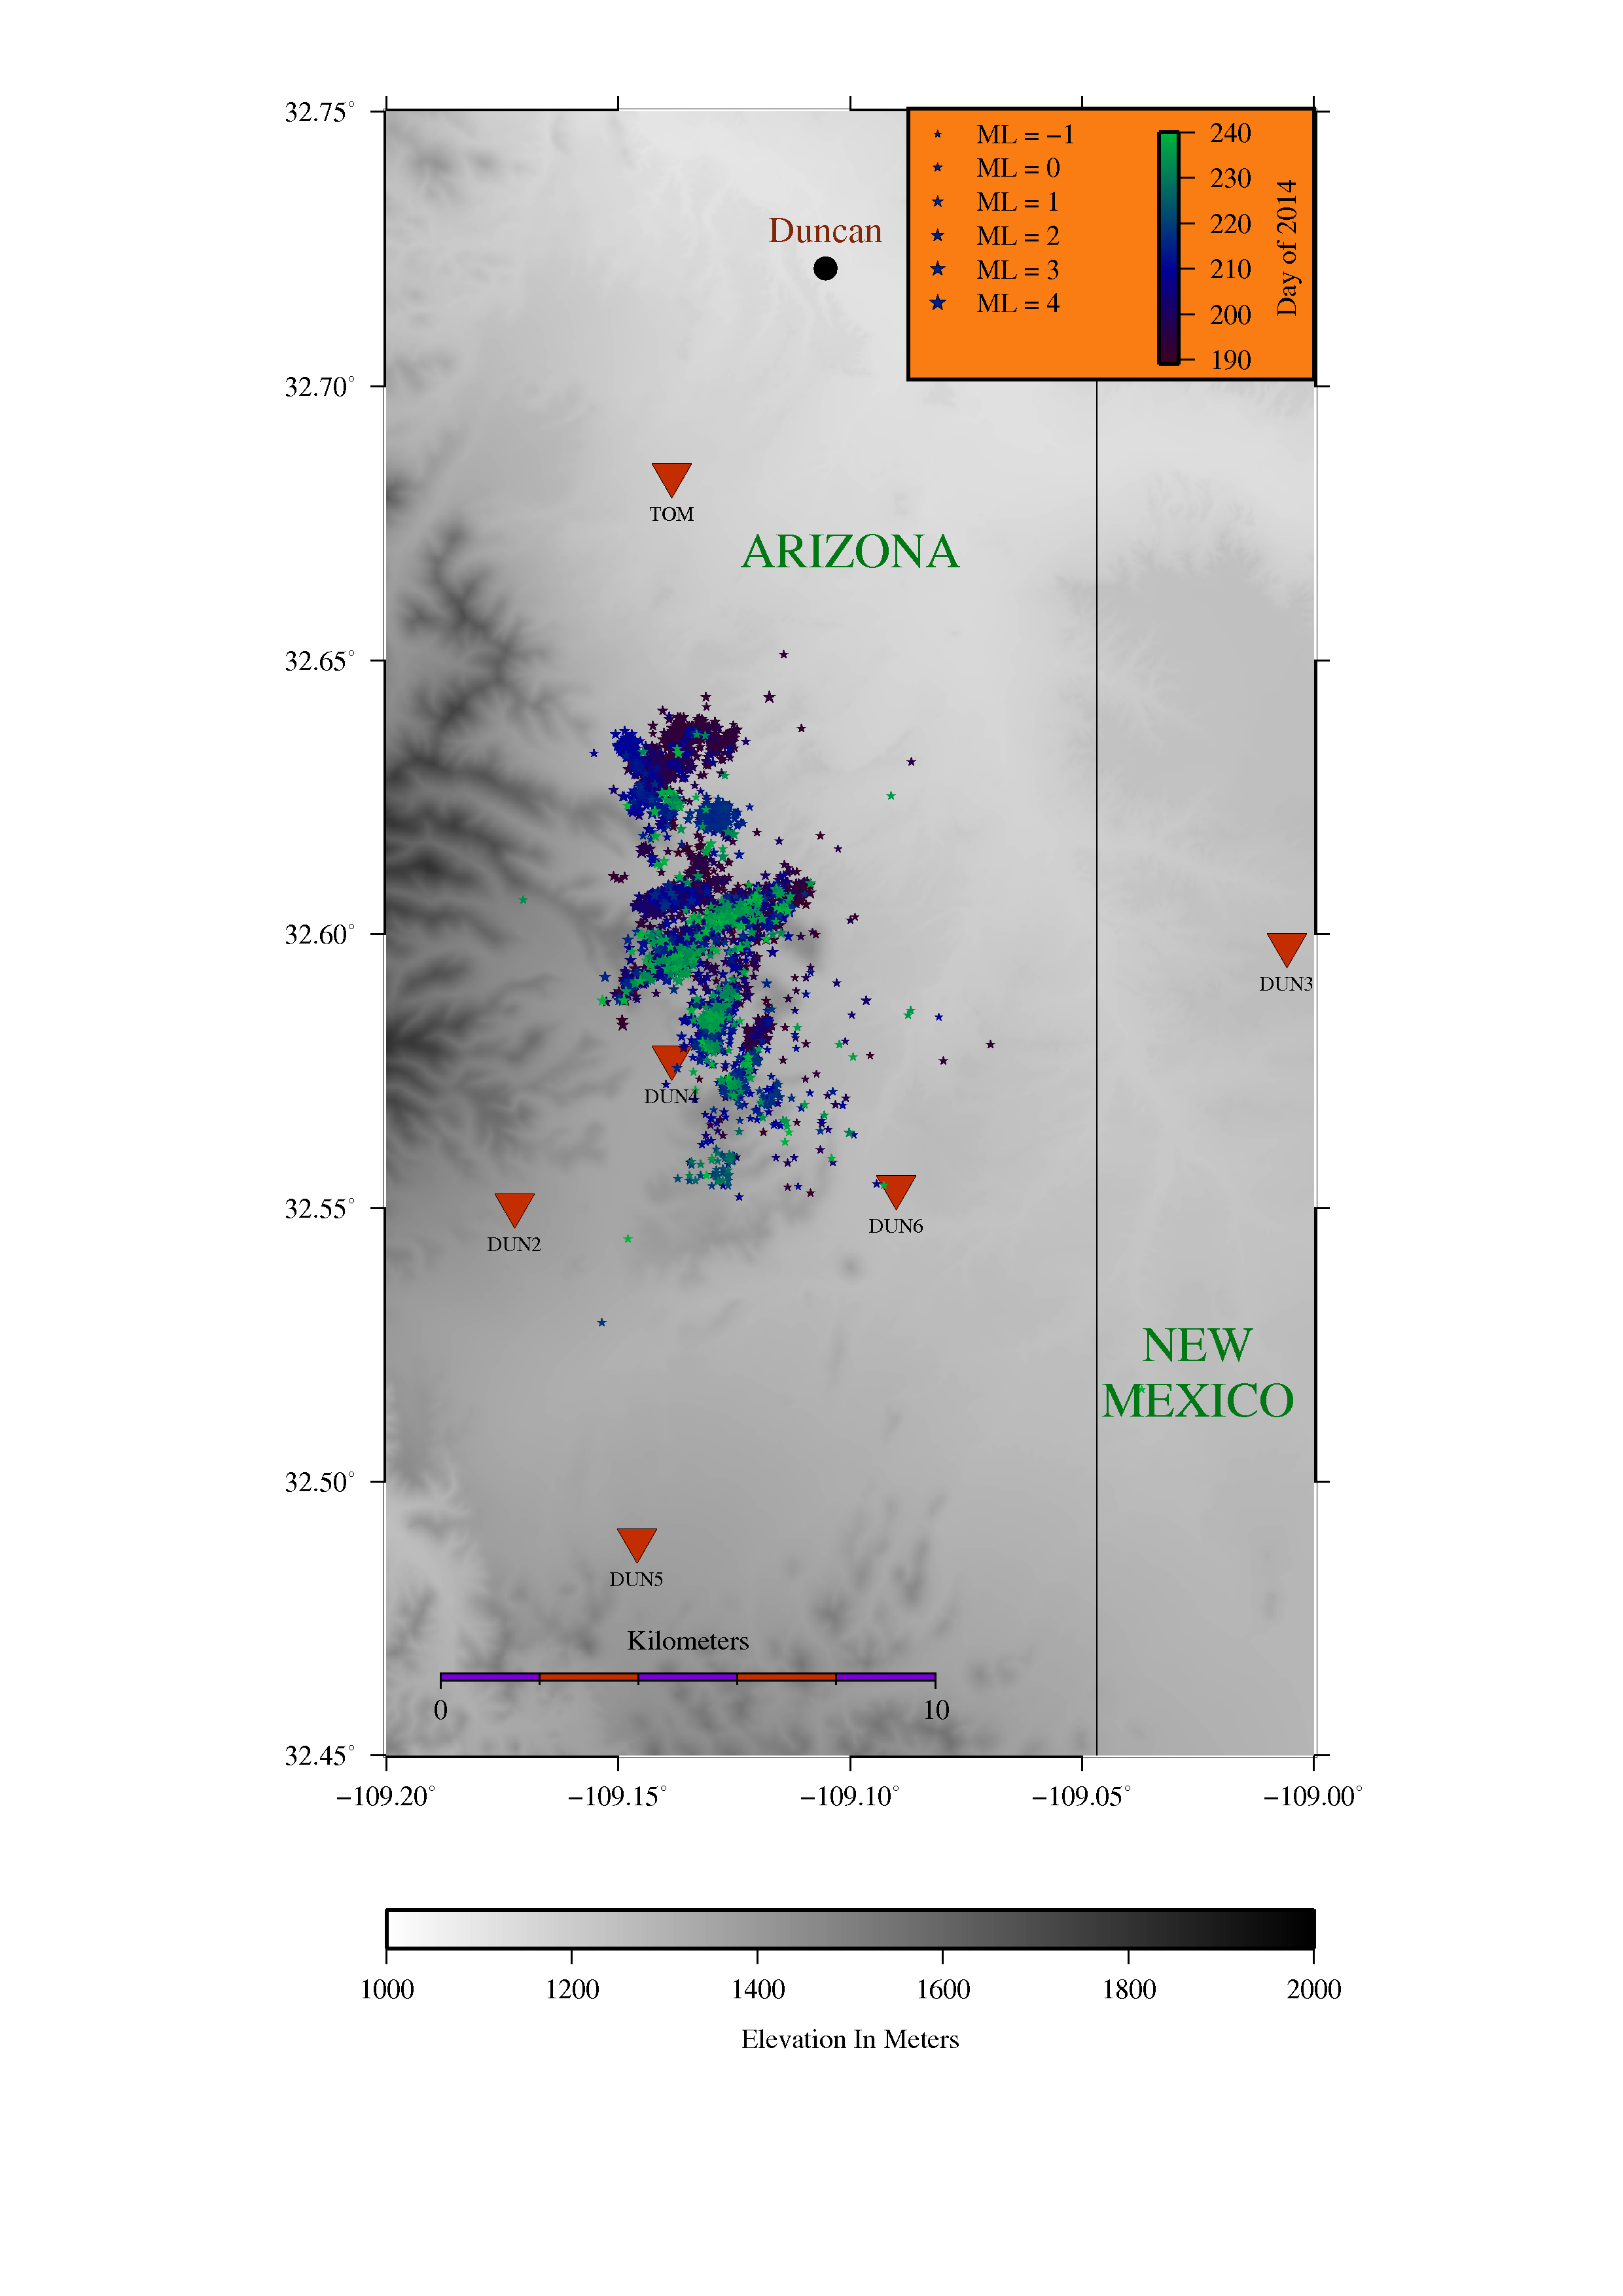
All right - now here's a map of my highest-quality preliminary aftershock epicenters from last year!
The map below shows the ~3,500 best-quality Duncan-area aftershocks from July 8 to August 28, 2014, where "best-quality" means latitudinal and longitudinal uncertainties of no more than one kilometer and nominal depth uncertainties of no more than five kilometers. The tiny stars show the aftershocks' epicenters; star color corresponds to origin time and size corresponds to nominal local magnitude, as shown by the legend. The orange triangles represent seismic stations. DUN1 and DUN2 were broadbands, and the others were short-period seismometers. The town of Duncan is represented by a black dot. Town coordinates are from "Cities and Towns of the United States" by the National Atlas of the United States.1 Elevation data are from the United States Geological Survey's one-arc-second National Elevation Dataset.2
1. Town coordinates are from the "Cities and Towns of the United States" Edition 2 dataset, March 2014, by the National Atlas of the United States, which you can find at https://catalog.data.gov/dataset/cities-and-towns-of-the-united-states-direct-download .
2. Elevation data are from the United States Geological Survey's one-arc-second National Elevation Dataset. https://viewer.nationalmap.gov/basic/?basemap=b1&category=ned,nedsrc&title=3DEP %20View
Also, major credit where credit is due! I made the above map with Generic Mapping Tools Version 4.5.15; you can find more information about GMT at http://gmt.soest.hawaii.edu/projects/gmt .